My Favourite DevTool Features
We have a lot of tools at our disposal when programming for the web. Shells, editors, IDEs, emulators, simulators, browsers and their associated dev tools, compilers, version control systems like GIT, build tools like webpack, the list goes on and on.
A common pitfall is to learn just enough of these tools to get by. We can end up using a shallow subset of these tools features like proverbial hammers rendering many problems nails. This can make day to day development alot harder than it needs to be.
You will spend a lot of time with these tools during your programming career. It’s worth getting to know them well. In this post I’ll share some features of Chrome DevTools you may not be aware of that I’ve found to be most useful in day to day hacking on thick client apps.
So with that said grab that flux capacitor. Where we’re going we don’t need console.log!
Console Utilities
Most folks are familiar with accessing browser globals window and document
from the console pane but you might not be aware Chrome DevTools ships with a
bunch of console utilities alongside these. Here’s a couple worth knowing.
$0 and friends
Say we want to obtain a reference to a particular DOM Element in the console so we can interact with it. There are a few common ways people tend to do this:
- use a DOM method from the console like
document.querySelector(selector) - Use
$(selector)which is an alias fordocument.querySelector. - Right click on an element from the Elements pane and select “store as global variable”.
There is another way that proves a lot more useful particularly when your
debugging concerns multiple elements. Meet $0 and it’s friends $1, $2, $3,
$4. These are special references in the console that point to the last
5 elements selected in the Elements Panel.
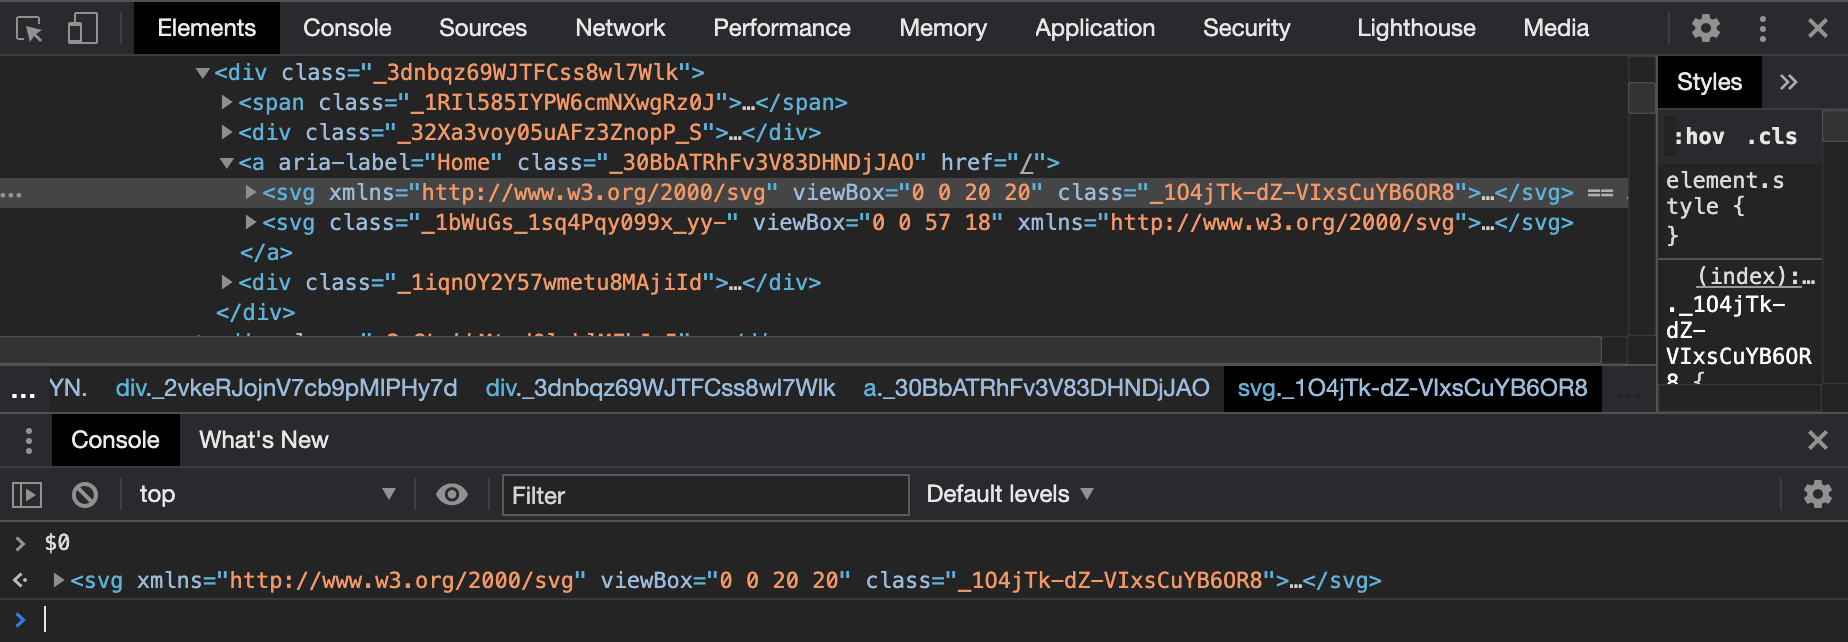
Right click a webpage and choose “Inspect Element”. Now navigate to
the console tab of dev tools drawer and type $0 and hit Enter.
You should see the element you selected logged to the console.
The events must flow: monitorEvents
Have you ever wanted to be able to see what events a particular DOM Element is receiving as you interact with a web page?
Maybe you’ve attached some event handlers but things aren’t being triggered as
you expect so you need a closer look. Sure you could throw in a console.log
into the event listener code but that just works for one event handler and
it also involves adding and removing code in order to debug things. Laborious!
The monitorEvents API of chrome dev tools allows you to see all events that
are received by any DOM Element as you interact with the page without adding any
additional app code. Let’s try it out.
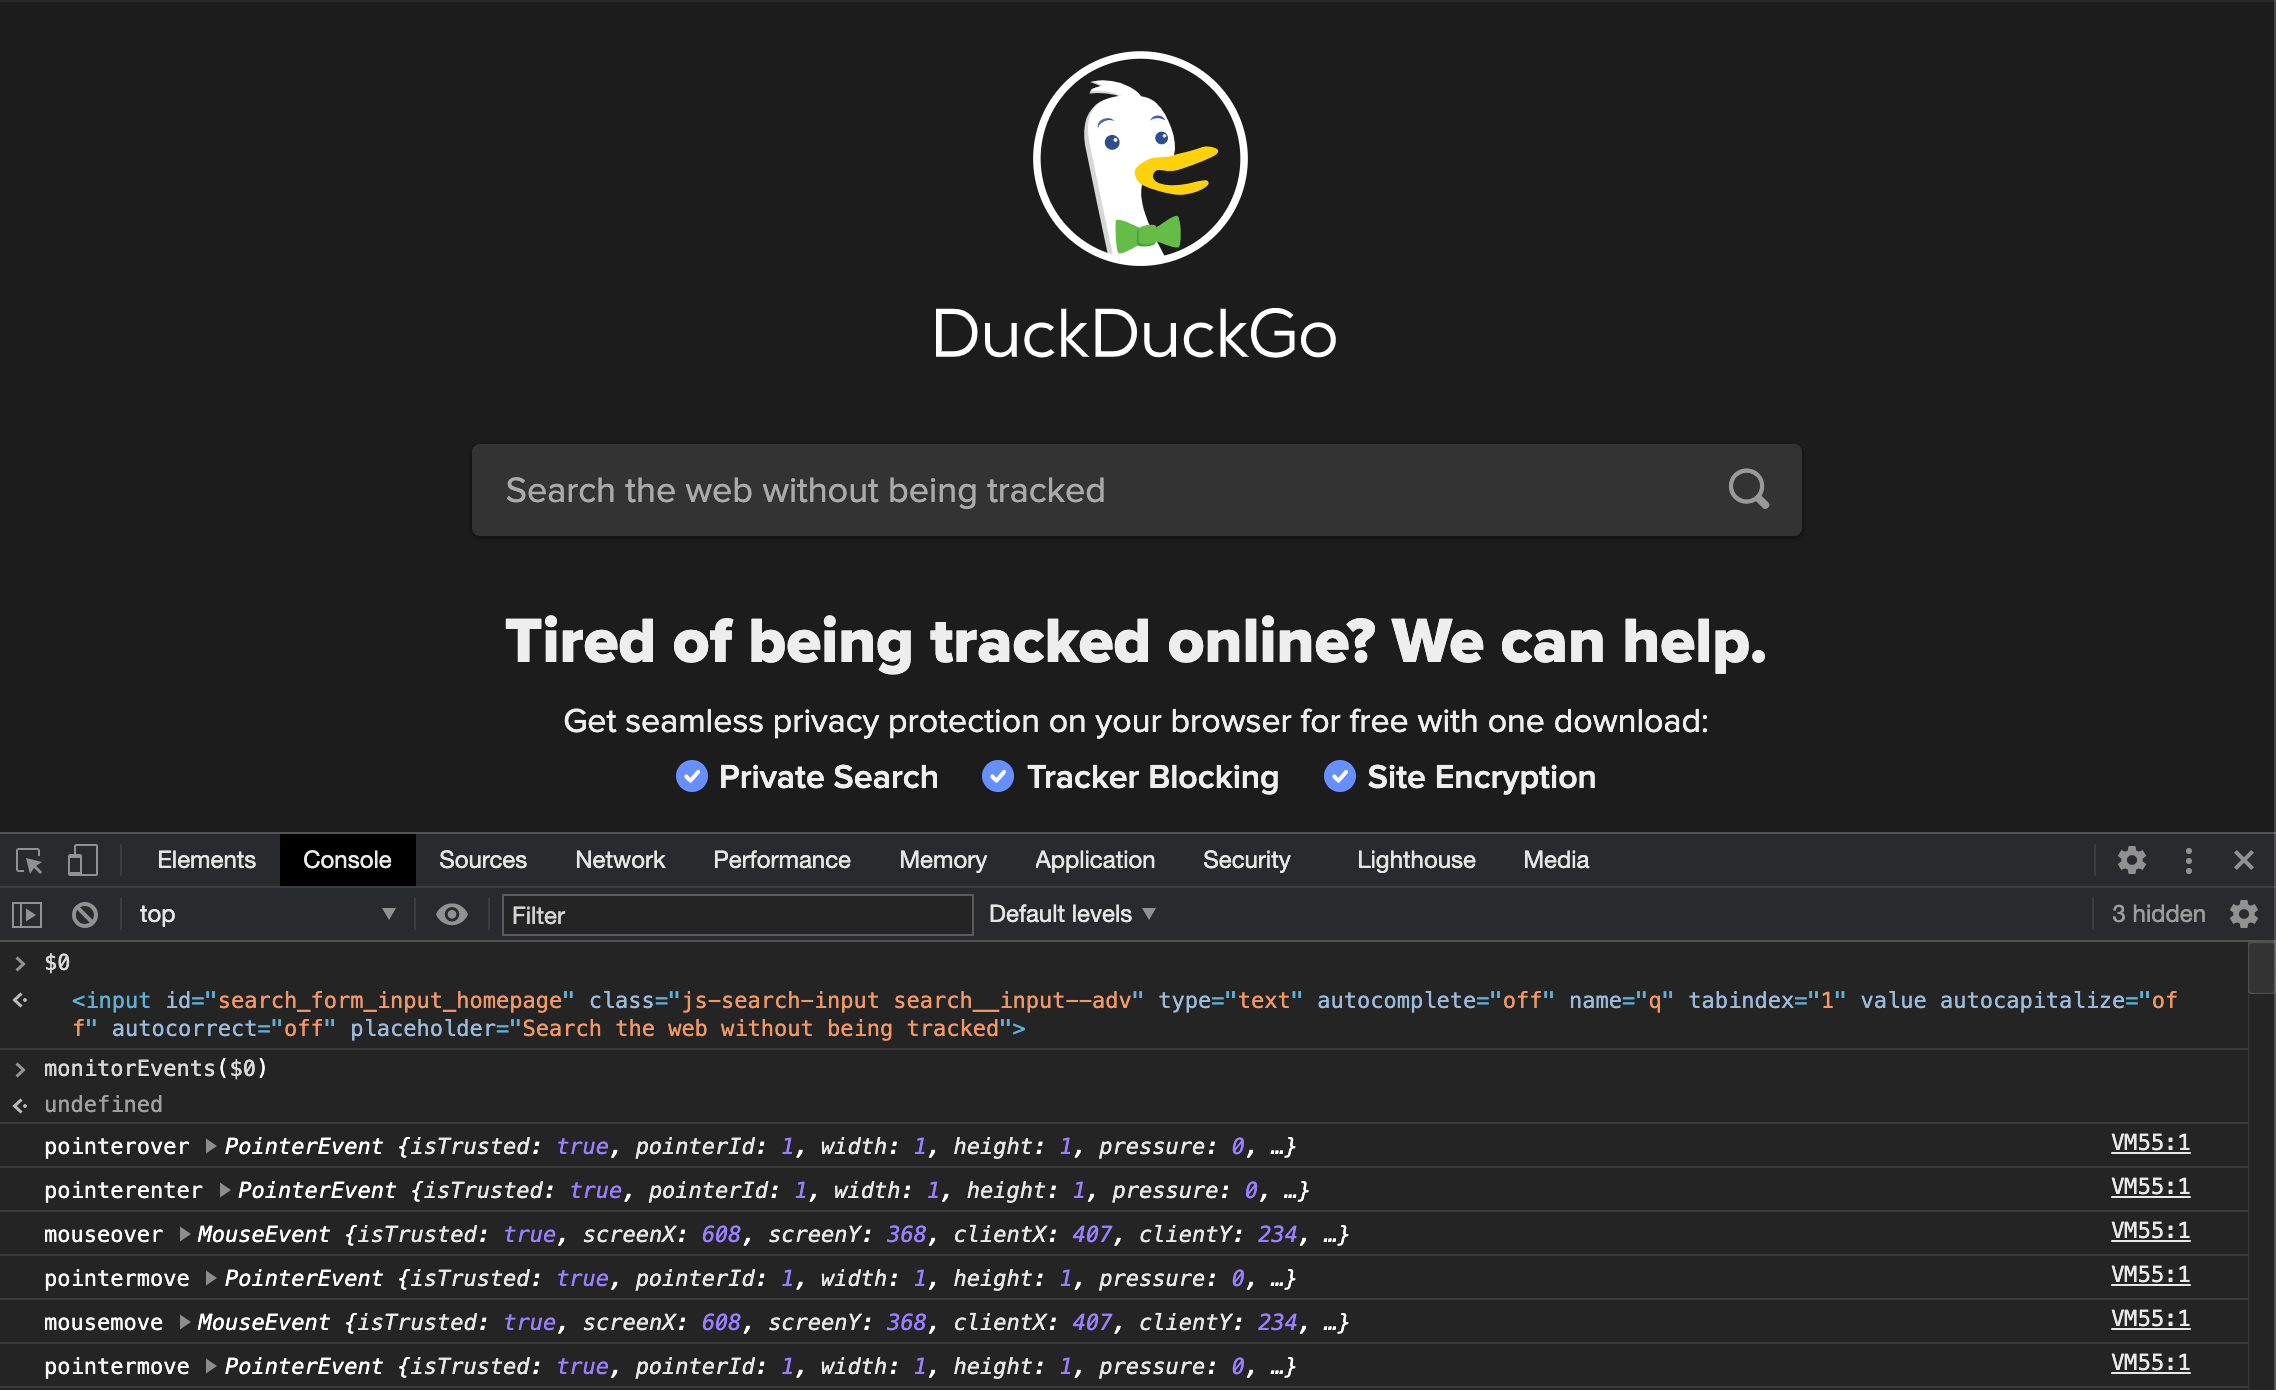
Open the Elements pane and select the Element you wish to monitor for events.
Now we are going to use our special $0 reference we learned earlier to pass a
reference to the DOM Element we want to observe. Go to the console and type
monitorEvents($0).
Calling monitorEvents with a single argument will monitor all events for
that Element. We can also specify the exact event we want to monitor by
supplying a second argument: monitorEvents($0, 'click').
Hit Enter to invoke the monitorEvents function and then interact with the DOM
Element you chose to monitor in the web page. You should now see a stream of
events received by the Element you are monitoring logged to the console.
The Command Menu
The command menu is a faster way to navigate the DevTools UI and accomplish many common tasks without having to leave your keyboard.
With DevTools open, you can open the command menu on Mac by pressing
Command+Shift+P.
You should now see the command menu:
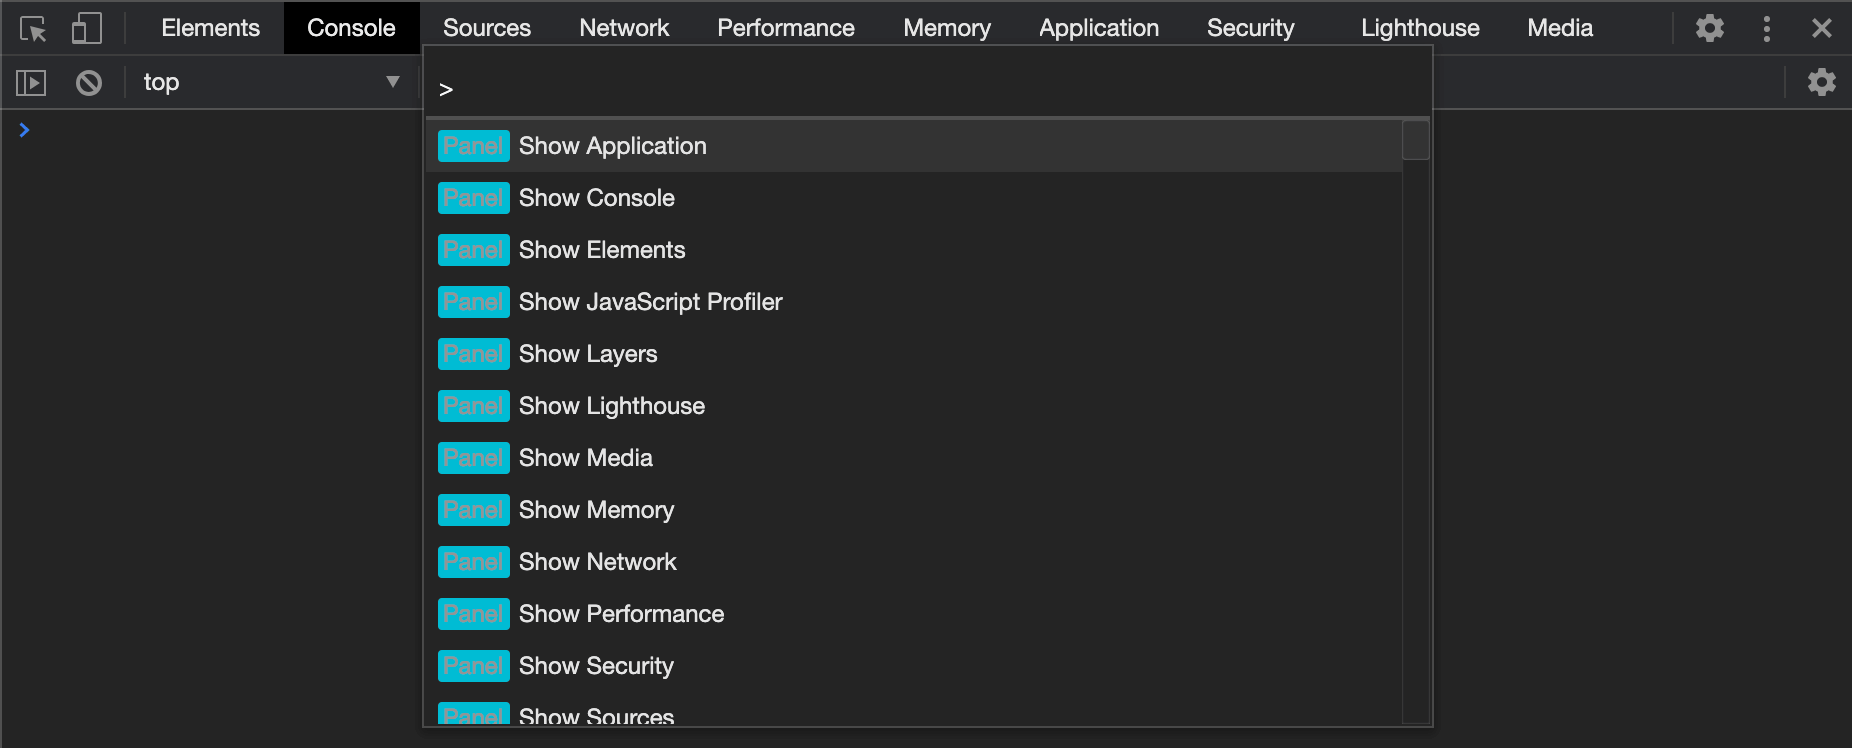
The available commands are segmented in to various categories like Network, Debugger, Rendering etc. and you can leverage the menu fuzzy search to find the one you want quicker.
Take a moment to scroll through the list and get an idea of the commands available.
The DevTools Drawer
DevTools provides access to it’s 9 main panes (Elements, Console, Sources etc.) via tabs at the top of the DevTools window.
You’d be forgiven for not knowing that there is an additional set of 19 panes hidden away in what’s called the DevTools Drawer. You can find them by clicking the three dots on the right of the main DevTools Tab Bar and selecting “More Tools” from the menu:
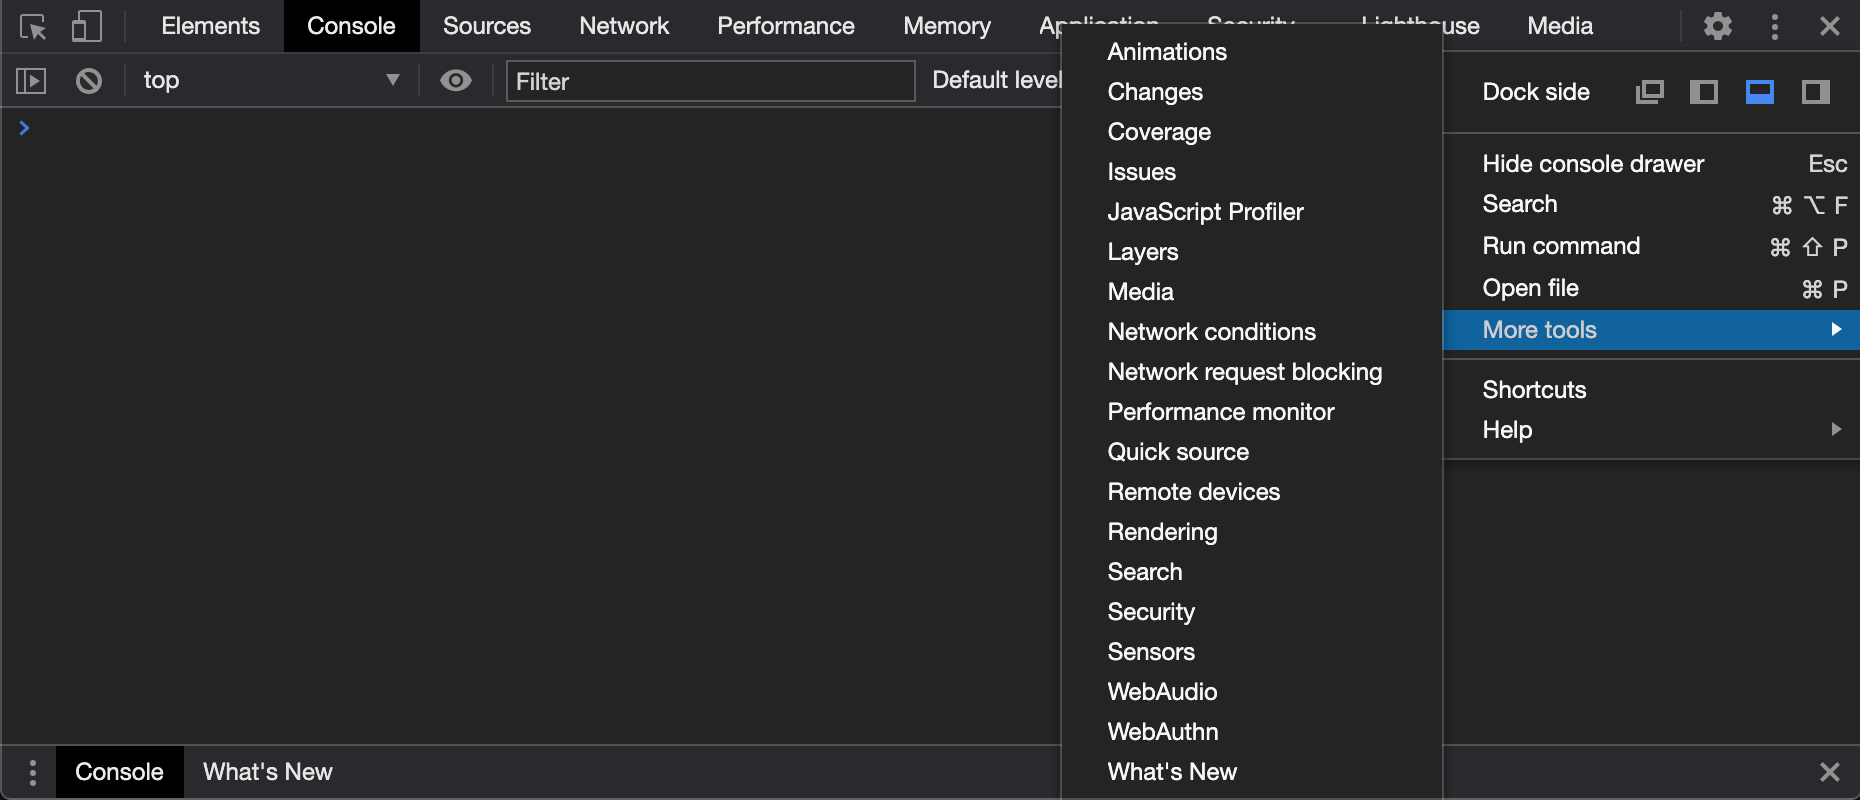
Let’s take a closer look at a couple of my favourite Drawer panes.
The Coverage Pane: Optimising Performance At Build-time.
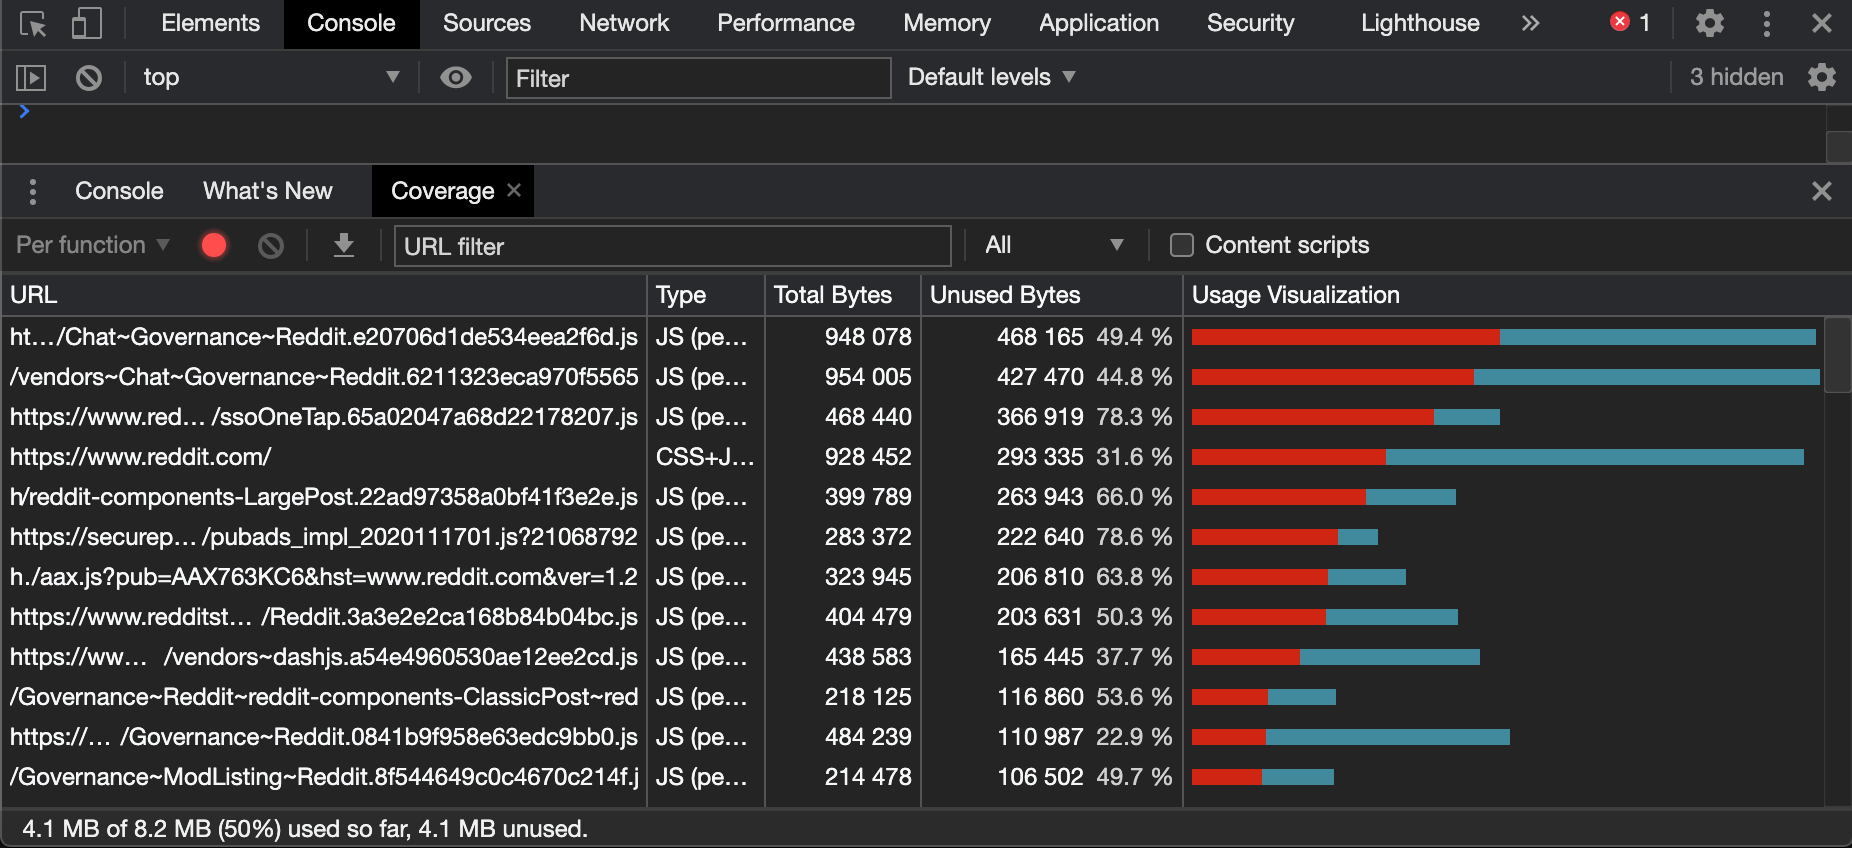
The code coverage pane allows you to analyze how much CSS and JS code was loaded versus how much was used. This helps to identify possible code splitting opportunities in order to optimise our build and only load stuff a user actually needs at a given time.
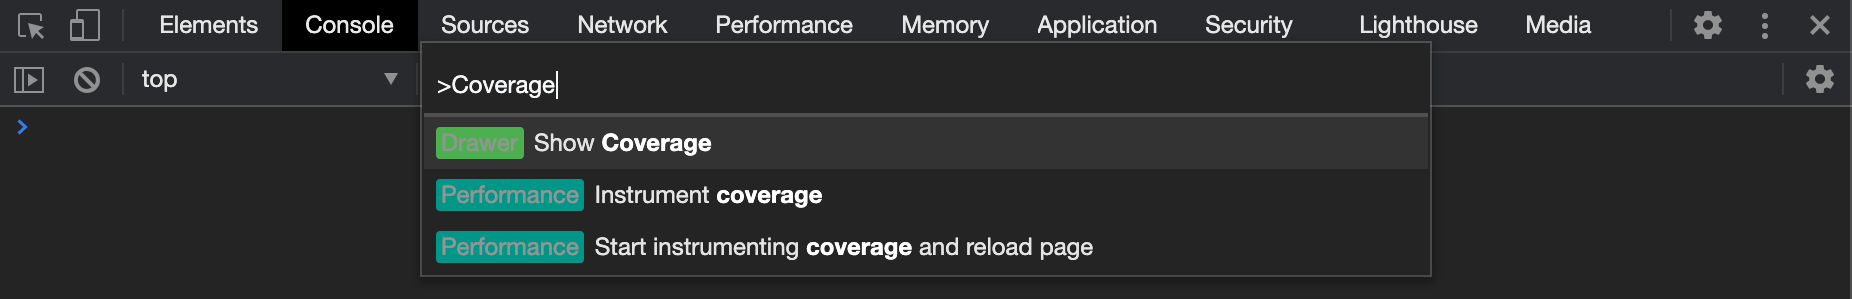
Lets perform a quick analysis. Navigate to any webpage, open the DevTools, launch the Command Menu and type “coverage”. You should see a “Show Coverage” command:
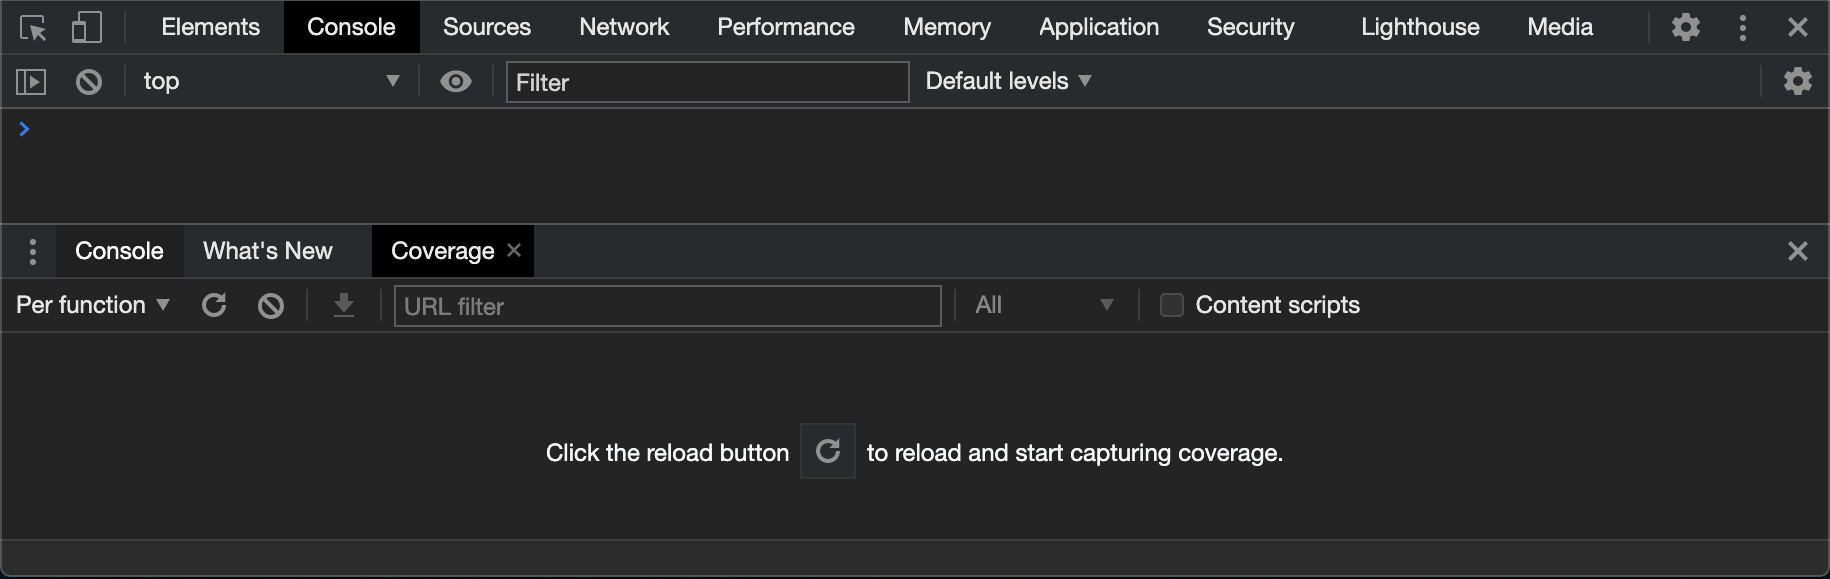
Hit enter and you should see a new drawer tab labelled “Coverage” and its corresponding pane should be visible:
Click the reload button. This will instrument the CSS and JS code on the page and reload it producing a coverage report:
leverage network throttling to simulate differing network conditions.
Performance Monitor: Optimising Performance At Runtime.
In terms of CPU/RAM, it’s safe to say developers are generally asymmetrically much better off than the average user of apps being built with high end development machines.
Don’t be surprised if you get hit with a bug report out of the blue one day complaining that your site is slow. Maybe it’s a memory leak. Maybe you are triggering too many reflows and the CPU is getting maxed out. Web perf is hard and there are many possible causes for performance issues. For that reason, it’s useful to get an initial view at 50,000 ft. so that you can appropriately narrow the scope of your debugging efforts.
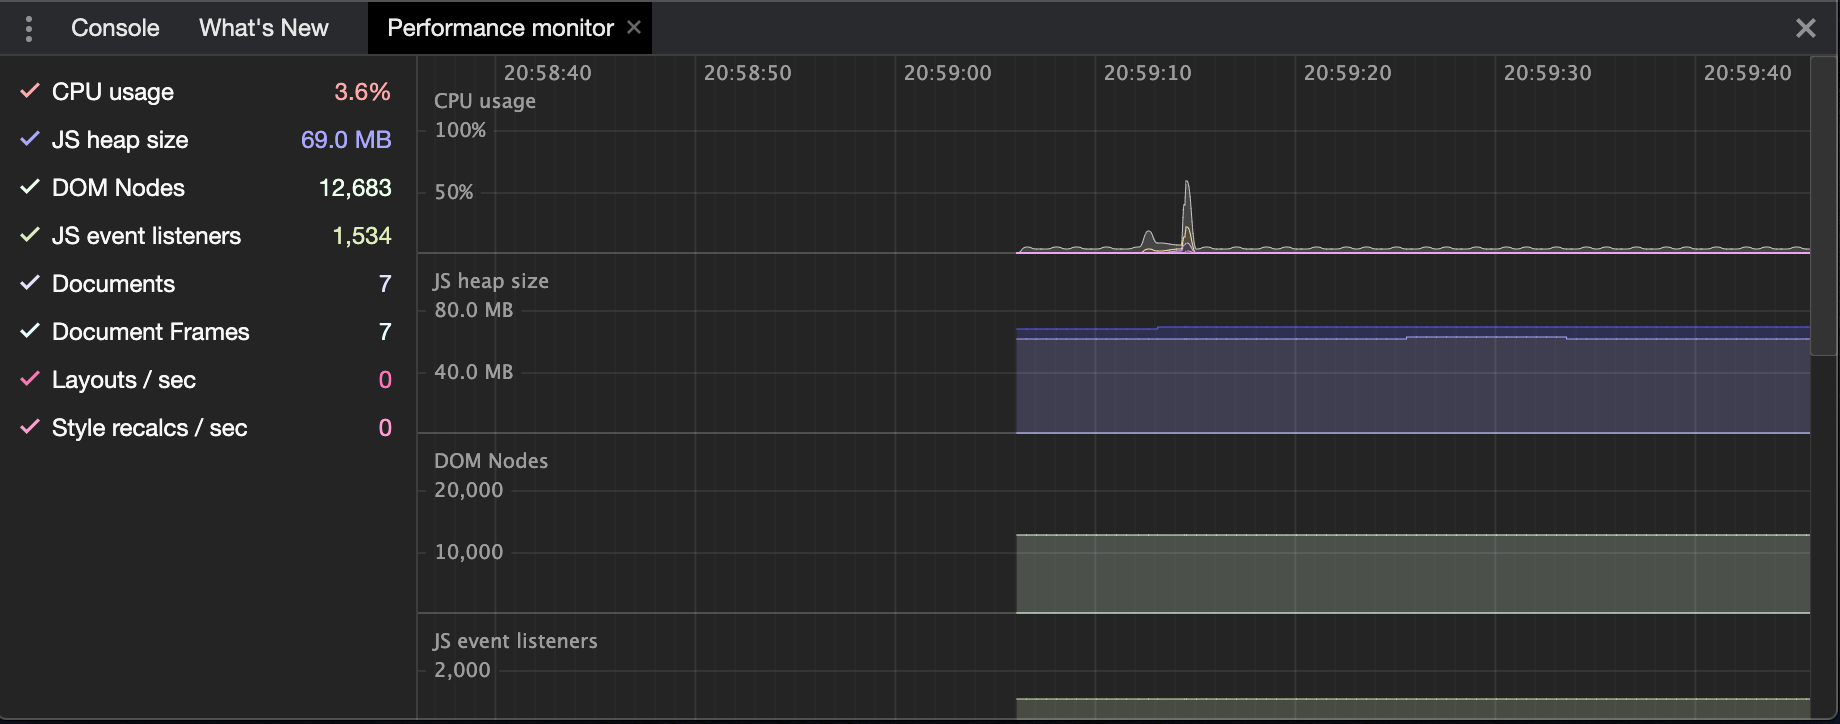
The Performance Monitor drawer pane allows us to easily see some high level runtime performance metrics like CPU usage, JS Heap Allocations and more.
Again the the easiest way to bring up the performance monitor is via the Commmand Menu. Open it and type “Show Performance Monitor” and hit Enter. You should now see a new Drawer pane tracking key perf metrics over time:
leverage cpu throttling to see how your site performs on less powerful devices.
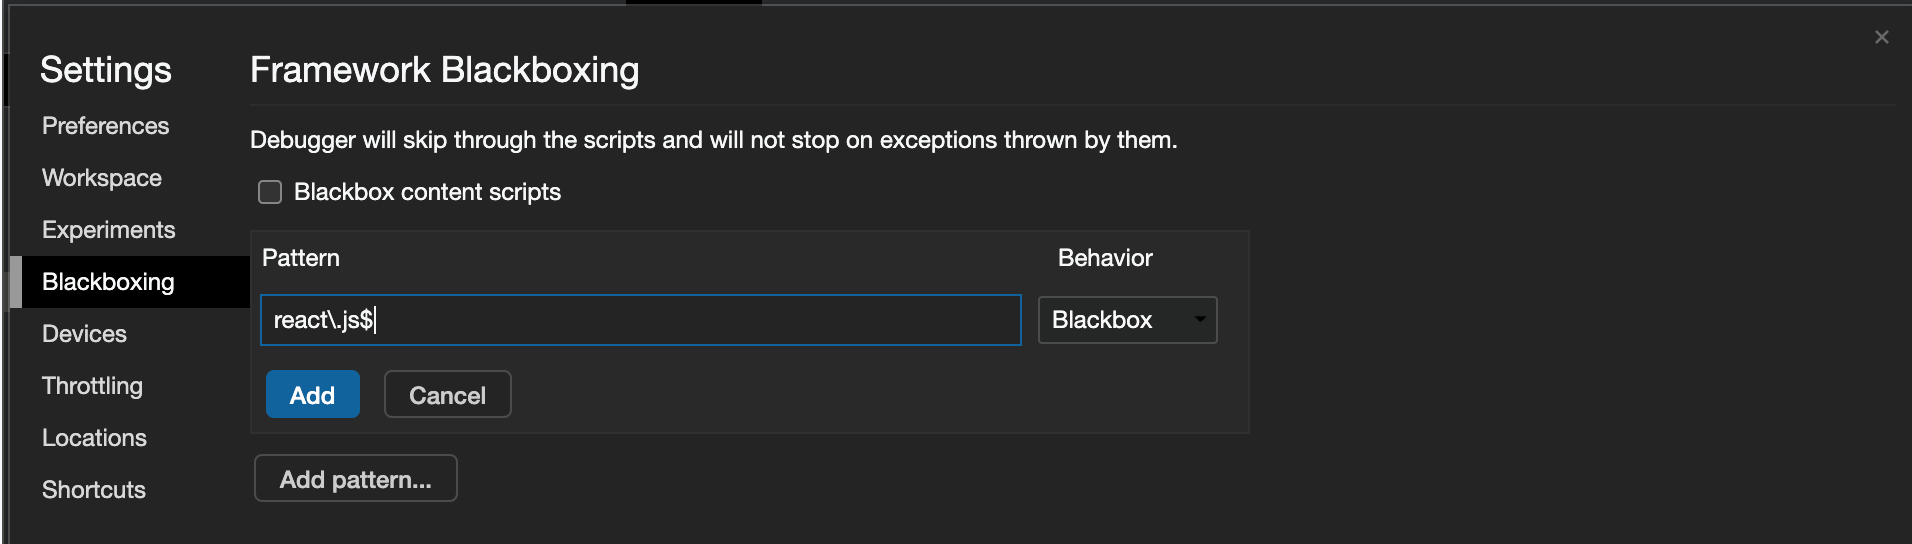
Script Blackboxing
More often that not, when working with the JS debugger you are more interested in your own application code rather than any 3rd party code that is being executed.
Script Blackboxing is way to ignore specific files while debugging. When a script is blackboxed, it won’t appear in the Call Stack pane and even better, when stepping through code, the blackboxed scripts will be skipped.
The best way to blackbox scripts is via the Settings pane. Open DevTools and click the cog on the far right to open the settings and select “blackbox”. Here you can add a pattern to blackbox any scripts you wish to ignore when debugging!
Local Overrides
Local overrides are a way to persist changes you make to your code via DevTools and have them persist across page reloads. This feature is particularly handy when collaborating with designers to make UI tweaks on the fly.
To enable local overrides, open the DevTools and select the Sources tab. Select Overrides from the sub menu and click “Select folder for overrides” to choose a directory where DevTools can persist your changes.
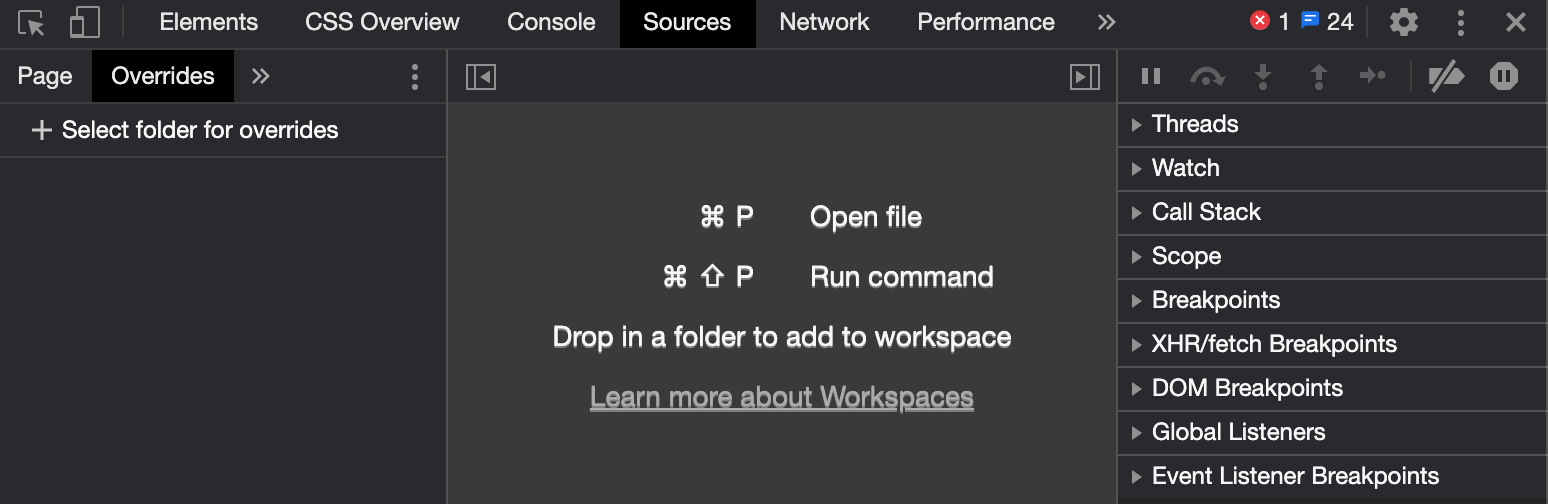
With overrides enabled, DevTools will now serve any local modified files rather than the original resources.
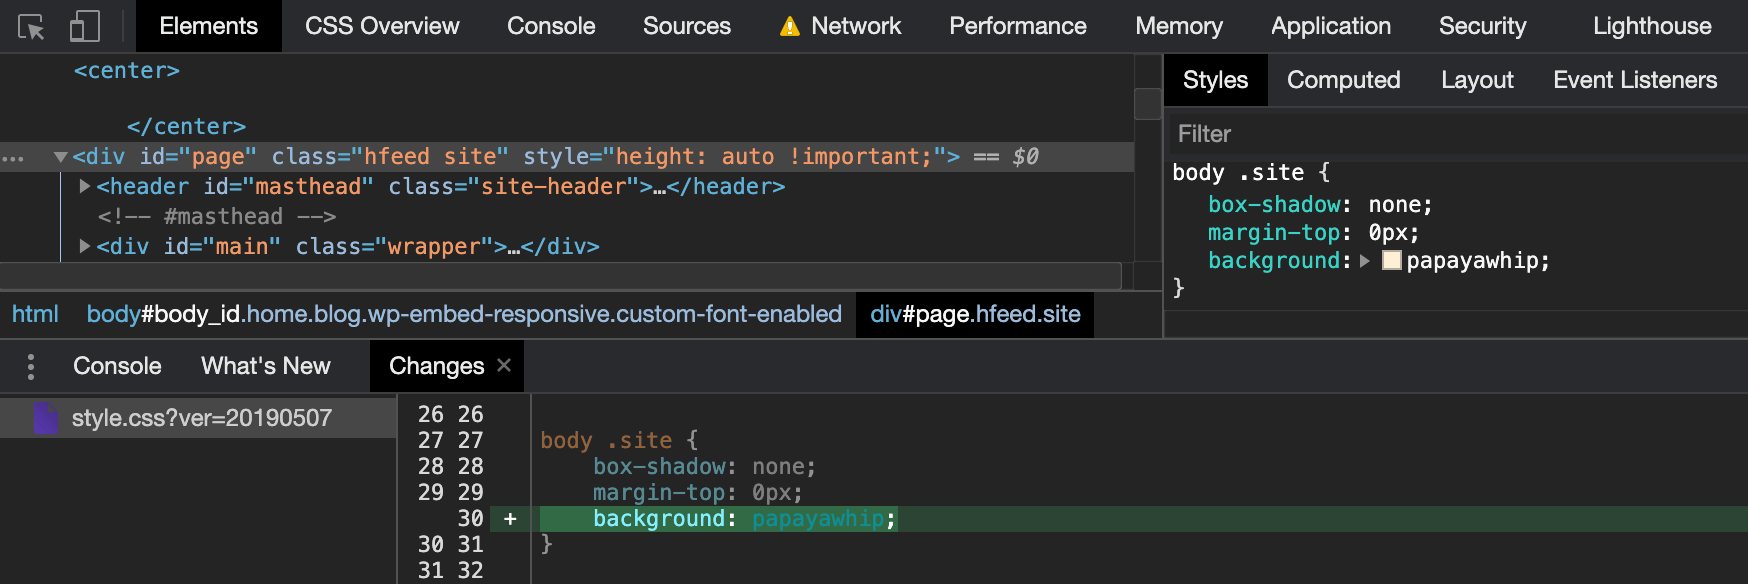
Give it a shot. Change a CSS property via the Styles sub-menu of the Elements pane and refresh the page. You should see your change persist across page reloads.
Chrome also gives you a way to easily track these changes. Open the Command Menu and search for “Changes” hit enter on the “Show Changes” Drawer menu item.
Hopefully some of these DevTool features are new to you. If so I encourage you to try incorporating them in to your day to day development workflow. It will take time to build some new muscle memories but sometimes you gotta go slow to go fast!